Charts
Charts
DBeagle can turn compatible query results into charts without leaving VS Code.
When chart view is available
Charting becomes available when the result set includes:
- At least one numeric column
- A chart-friendly X axis, such as a categorical, temporal, or numeric column depending on the chart type
If the result does not support charting, DBeagle keeps you in grid view and explains why.
Supported chart types
- Bar
- Line
- Pie
- Scatter
Important behavior: charts unlock after finalization
While a query is still streaming, DBeagle can prepare chart options, but full chart interaction waits until the result set is finalized.
That keeps chart controls stable and avoids expensive recalculation on partial data.
Choosing axes
Use the chart controls to map:
- The X axis column
- The Y axis column
- The chart type
Scatter charts require two numeric columns. Other chart types need one numeric Y axis and a chart-friendly X axis.
Chart data source
Depending on the result set and chart type, DBeagle may label chart data as:
aggregatedsampled
When the chart says it is bounded for readability, DBeagle has intentionally limited the plotted output rather than trying to render every possible point.
Best practices
- Aggregate in SQL before charting large raw datasets
- Use line charts for trends over time
- Use bar charts for comparisons across categories
- Use scatter charts when you want to compare two numeric measures
Exporting charts
Use the export menu in chart view to save the current chart as a PNG image.
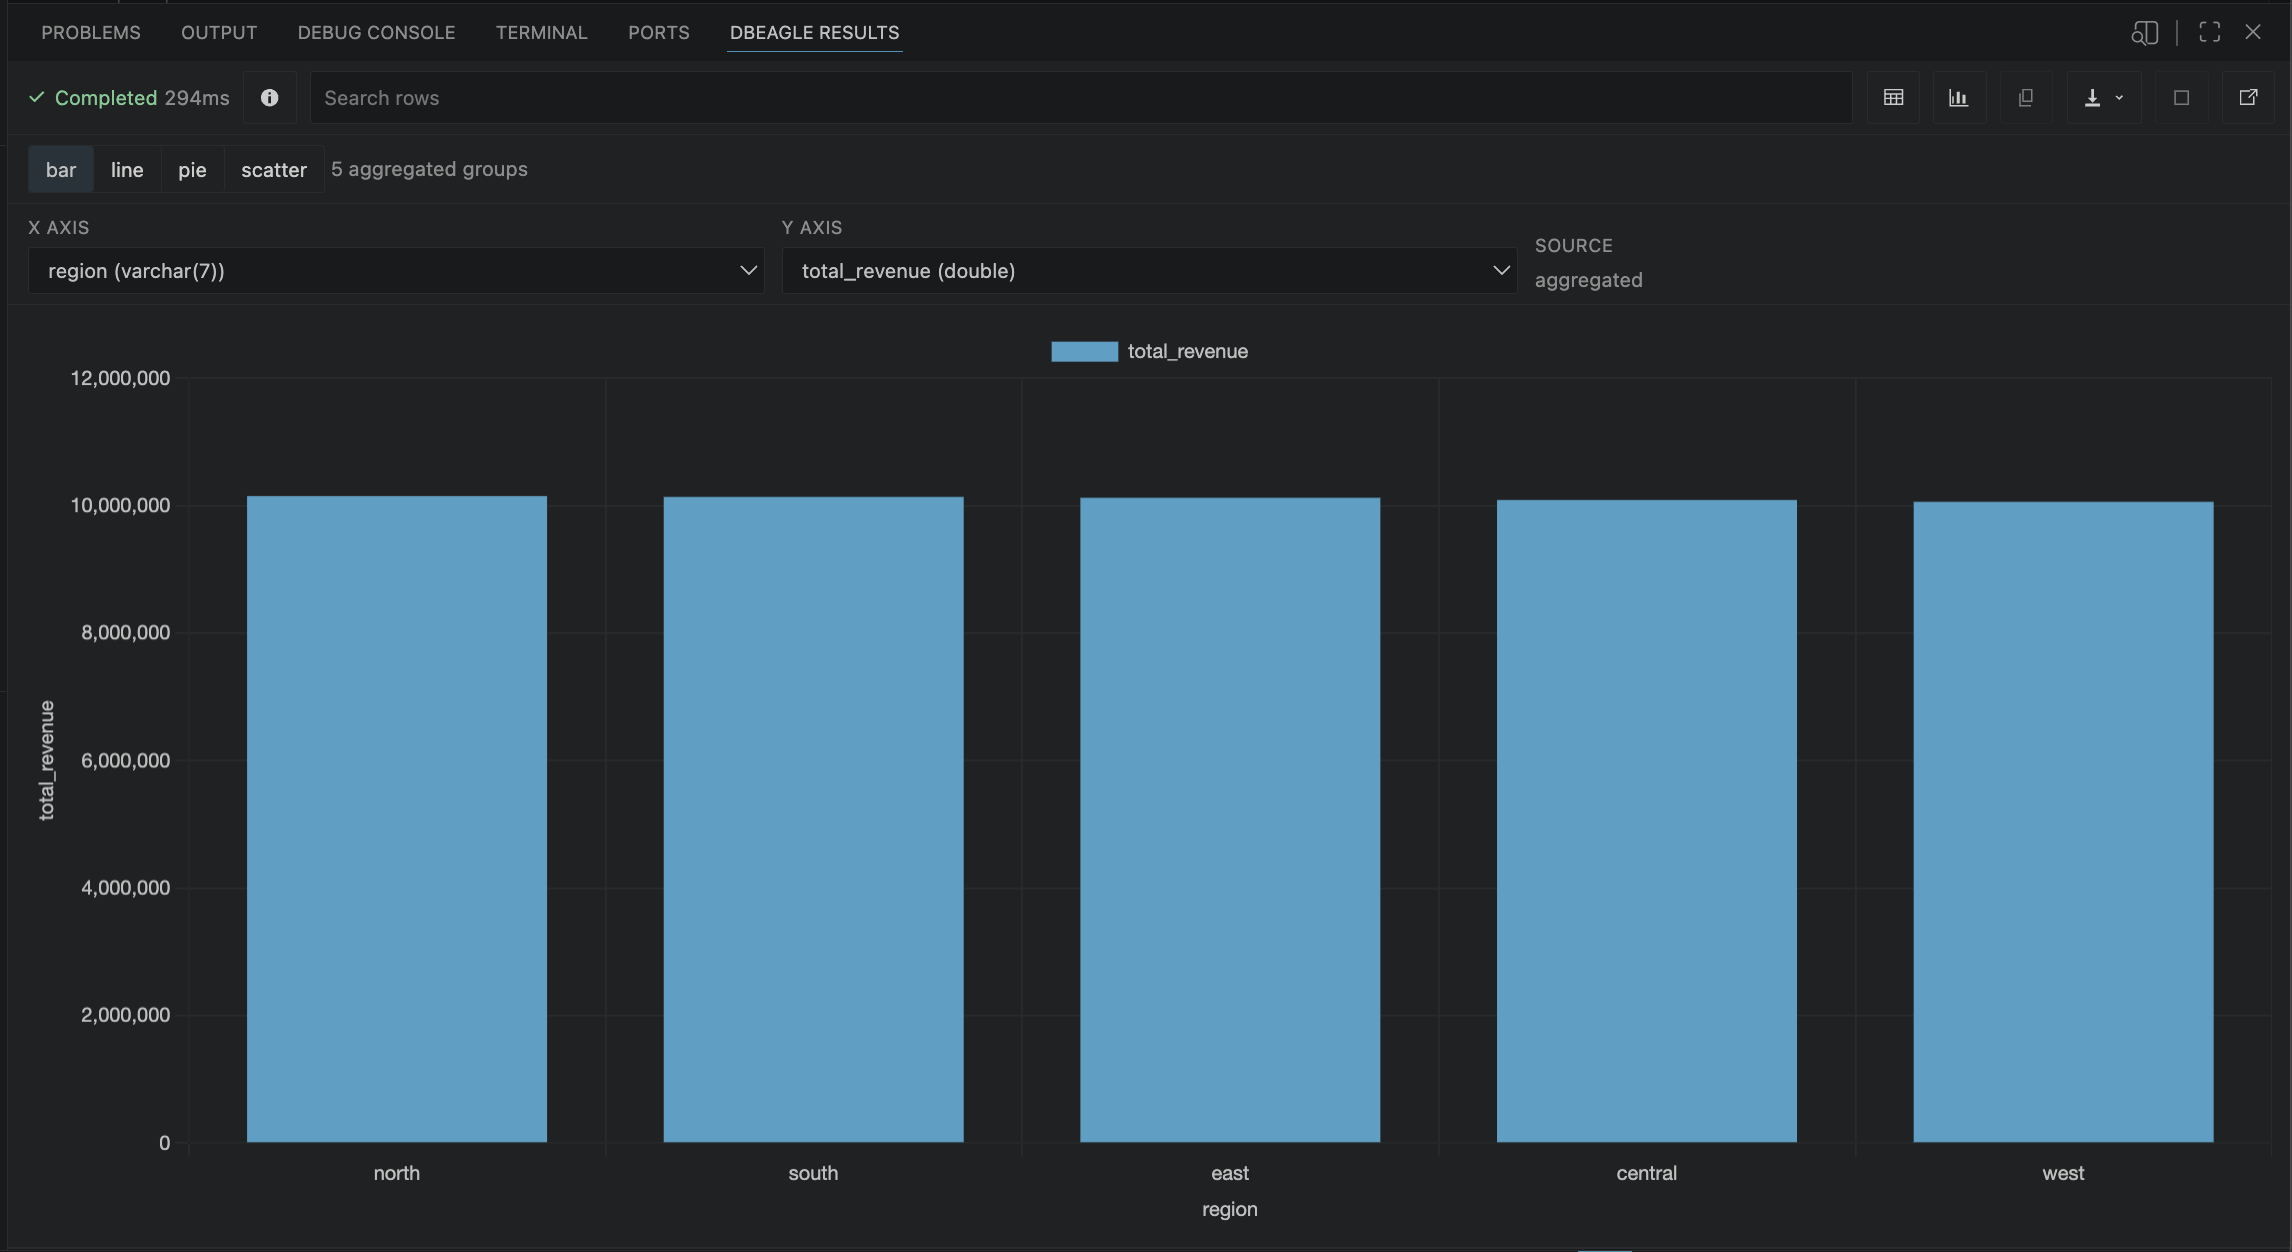
Chart view rendered directly from a DBeagle result session.
Related settings
dbeagle.chart.defaultTypedbeagle.chart.respectTheme